Evening traders,
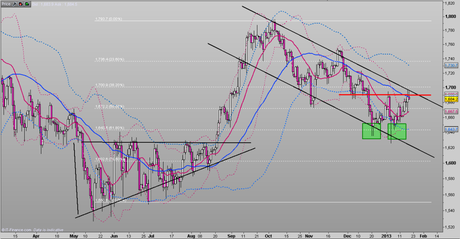
I have a chart of Gold for today. Gold has been in a downtrend ever since testing 1800 last October. I draw a downtrend channel to illustrate the move. The 50-day MA – which I use for mid-term outlook – accted as a strong resistance guide throughout the last few months. Right now, Gold is exactly there; the last two trading sessions saw Gold closing just beneath the MA. I see a straightforward case for shorting Gold at this area. Resistance coming from the 50-day MA, a support-turned-resistance line, and a downward parallel channel are reasons for my bearish posture.
However, I do see something forming on Gold’s chart that may end up being a catalyst for the upside. In the chart below I have two green boxes showing a potential double bottom pattern. Gold may two dips at 1650 and the support-turned-resistance line I drew (red) are the parameters for this potential double bottom. This means I will have to play around with entry orders and not short Gold too quickly.

All analyses, recommendations, discussions and other information herein are published for general information. Readers should not rely solely on the information published on this blog and should seek independent financial advice prior to making any investment decision. The publisher accepts no liability for any loss whatsoever arising from any use of the information published herein.
