Evening all,
The local bourse has been creeping up over the last few weeks; volume is decidedly low, and it does not seem like any group of stocks is making headlines.
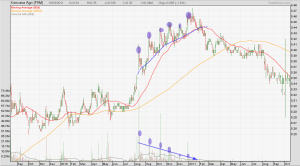
Today, I have two charts I want to place side-by-side - that of Frencken and of Kencana. Kencana Agri, F9M.SI, started climbing out of a consolidation in the second half of 2010, and was progressively making higher highs from August through December. At the same time, volume was in a downtrend. The spikes in volume on strong up-days were getting lower, and the general volume was declining. When 2011 came, Kencana reversed, and has never looked back since.
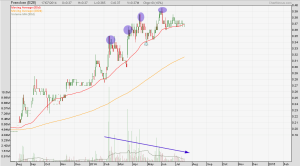
Moving the attention to Frencken, E28.SI, I have an up-to-date chart below. Frencken has been in a very strong uptrend for quite some time: a 45% showing in 2013, and 42% thus far for this year. Since the start of this year, Frencken has been making higher highs in stock price but lower highs in volume of shares traded. I think the picture looks the same as in Kencana. Frencken is, and Kencana was, riding nicely above the 50- and 200-day MAs.


On any other day, I will be bullish on Frencken because of the nice trend in place. However, with such a “suspicious” formation that looks so much alike to another in the past – and from another chart – I have to be cautious. Let us see how this goes.
All analyses, recommendations, discussions and other information herein are published for general information. Readers should not rely solely on the information published on this blog and should seek independent financial advice prior to making any investment decision. The publisher accepts no liability for any loss whatsoever arising from any use of the information published herein.
