Comment on the New EPA Toxic Releases Report
GR: It is worth noting that the EPA report does not include toxic releases from small facilities, home heating, automobiles, and others. To get insight to the magnitude of human impacts on nature, consider the fact that toxic wastes are not the leading cause of damage to wildlife and habitat. Worldwide, construction and invasive species are more destructive than toxic wastes. The enormous quantity of toxic materials we produce, gives a sense of just how gigantic is the impact of construction and invasive species. It is not surprising that more than half of Earth’s wildlife is gone and the rest is fading fast.
U. S. Toxic Chemical Release Inventory (TRI)

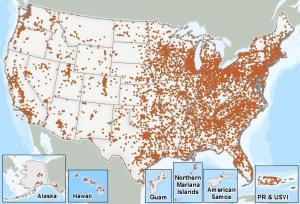
Locations of all facilities that reported to TRI for 2013
The U. S. Environmental Protection Agency has released its annual report on toxic wastes. This information comes from thousands of U.S. facilities and includes over 650 chemicals and chemical categories under the Emergency Planning and Community Right-to-Know Act (EPCRA) and the Pollution Prevention Act (PPA).
“The map shows the locations of all facilities that reported to TRI for 2013. Facilities that report to TRI are typically large and are from industry sectors involved in manufacturing, metal mining, electric power generation, and hazardous waste treatment. Federal facilities are also required to report to TRI by Executive Order 12856.
“Users of TRI data should be aware that TRI captures a significant portion of toxic chemicals in wastes that are managed by industrial facilities, but it does not cover all toxic chemicals or all industry sectors of the U.S. economy. Furthermore, the quantities of chemicals reported to TRI are self-reported by facilities using readily-available data. Each year, EPA conducts an extensive data quality analysis before publishing the National Analysis. During the data quality review, potential errors are identified and investigated to help provide the most accurate and useful information possible. This effort makes it possible for TRI data presented in the National Analysis to be used along with other information as a starting point in understanding how the environment and communities may be affected by toxic chemicals.
“The TRI National Analysis is developed on an annual basis, and the 2013 TRI National Analysis is EPA’s interpretation of TRI data reported for 2013 by July 1, 2014. It provides a snapshot of the data at one point in time. Any reports submitted to EPA after the July 1st, 2014 reporting deadline may not be processed in time to be included in the National Analysis. The most recent data available are accessible from the TRI Data and Tools webpage.
Quick Facts for the U. S. for 2013
Number of TRI Facilities 21,598
Production-Related Waste Managed 25.63 billion lb
Recycled 9.23 billion lb
Energy Recovery 2.91 billion lb
Treated 9.49 billion lb
Disposed of or Otherwise Released 4.00 billion lb
Total Disposal or Other Releases 4.14 billion lb
On-site 3.74 billion lb
Air 0.77 billion lb
Water 0.21 billion lb
Land 2.75 billion lb
Off-site 0.41 billion lb
Note: Numbers do not sum exactly due to rounding.
“Additional information is presented in the following chapters of the TRI National Analysis:
- Waste Management and Pollution Prevention presents trends in toxic chemicals managed and the types of pollution prevention activities that facilities have implemented.
- Releases of Chemicals presents trends in releases of toxic chemicals, including a focus on selected chemicals of concern.
- Industry Sectors highlights toxic chemical waste trends for four industry sectors.
- Where You Live presents analyses of TRI chemicals by state, city, county, zip code, metropolitan area or micropolitan area, and by Large Aquatic Ecosystems (LAEs) such as the Chesapeake Bay, as well as information about facilities in Indian Country.
- TRI & Beyond combines TRI data with other EPA data, such as greenhouse gas emissions, to provide a more complete picture of national trends in chemical use, management and releases.
“To conduct your own analysis of TRI data, use EPA’s TRI data access and analysis tools available to the public from the TRI Data and Tools web page.”
GR: The EPA report is a primary resource for studying U. S. toxic materials releases. I haven’t tried all the Tools, but they look useful. I tried the “where you live” tool for the state of Arizona. The display was slow, but produced interesting results (summary table below).
Quick Facts for Arizona 2013
Number of TRI Facilities: 257
Facilities Reporting Newly Implemented Source Reduction: 45
Total On-site and Off-site Disposal or Other Releases: 70,121,662 lbs
Total On-site: 69,030,728 lbs
• Air: 2,400,897 lbs
• Water: 832 lbs
• Land: 66,628,999 lbs
Total Off-Site: 1,090,934 lbs

