This post follows up on my discussion of citation frequencies in abstracts in rhetoric and composition journals. To reiterate, a safe assumption to make is that citations in abstracts are “central” to the arguments presented and the research undertaken in the articles themselves; they are particularly informative about overall trends. The genre of the humanities article demands more citations than a core argument actually requires, so looking at citations in abstracts should control for that genre requirement, distilling down all citations to the most vital ones.
The journals: College Composition and Communication (CCC), Rhetoric Society Quarterly (RSQ), and Rhetoric Review (RR). The CCC abstracts run from February 2000 (51.3) to September 2011 (63.1), a total of 261 abstracts. The RSQ abstracts run from Winter 2000 (30.1) to Fall 2011 (41.5), a total of 220 abstracts. The RR abstracts run from 2002 (21.3) to 2011 (30.4), a total of 154 abstracts.
The previous post discussed the “long tail” distribution that emerged from the citation frequencies and what it means for disciplinary identity. This post presents information on the gender of the sources cited in the abstracts, then makes a few comments about demographic distributions in general.
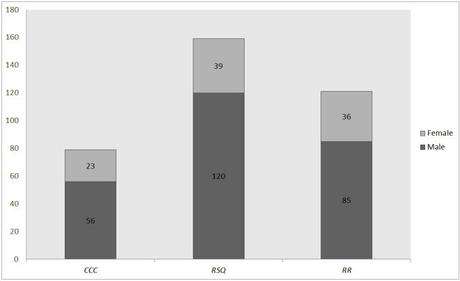
There are 79 unique citations in the CCC abstracts; 159 unique citations in the RSQ abstracts; and 121 unique citations in the RR abstracts. (See previous post for .xls data files.) Here’s how the gender distribution falls: in CCC, 23 out of the 79 sources are female; in RSQ, 39 out of the 159 sources are female; in RR, 36 out of the 121 sources are female.
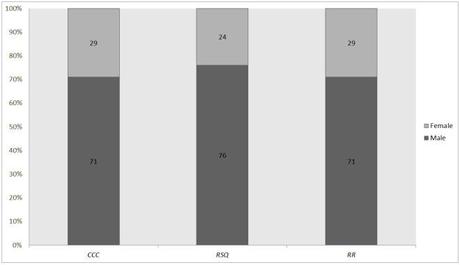
And here are graphs of the raw counts and of the percentages:

Abstract citations by gender (raw count)

Abstract citations by gender (percentage)
In Authoring a Discipline, Maureen Daly Goggin has shown that by 1990 total contributors to 9 of rhetoric and composition’s major journals—including the 3 analyzed here—had equalized to a nearly 50/50 split between males and females. I imagine this trend has continued into the new millennium, but it would be worthwhile to determine whether or not that’s the case.
What has not equalized, however, is the gender contribution in terms of citations. Odds are, counting all citations in the articles themselves would alleviate the large gap seen in the graphs above. But insofar as we accept that abstract citations represent the most vital sources in each journal, then an obvious gender gap still exists in CCC, RSQ, and RR citations.
In RSQ and RR, this gap, in part, likely has something to do with these journals’ tendencies to publish work on rhetorical history. I pointed this out in the last post: 27 (or 22%) of the RR citations are sources from the 17th century or earlier. 26 (or 16%) of RSQ citations are from the same period. Those numbers would grow if they included figures from the 18th and 19th centuries, as well. The reality is, most of these historical sources are male: Plato, Cicero, Aristotle, Quintilian, et cetera.
I have no ready explanation for why CCC citations should have as large a gender gap as the other journals’ citations, given that CCC builds most of its scholarship on sources from the middle part of the 20th century or later. If we look at the 102 most cited figures in CCC between 1987 and 2011 (Mueller, “Grasping”), we discover that 43/102 (42%) of the sources are female: a gender imbalance, but one not nearly as pronounced as the imbalance that surfaces in abstract citations. I’d be curious to see the gender distribution in Mueller’s entire data set. Is there a nearly 50/50 split between male and female sources across all citations in CCC between 1987 and 2011? If so, we could model the gender imbalance in this journal’s citations as an emergent feature: 50/50 across the entire data set; 58/42 in the most popular citations between 1987 and 2011; 71/29 in abstracts between 2000 and 2011. It’s unfortunate that CCC did not publish abstracts until the late 1990s, so that the dates of the abstracts and the articles could be uniform.
The question of demographic balance is one that spills a lot of digital ink. Just this morning, Scott Weingart visualized the gender (im)balance of Digital Humanities Conference attendees: about a 70/30 split that favors males. And Google recently released the demographic characteristics of its workforce: 30% of its employees are women; 17% of its technical employees are women. 60% of its employees are white; 30% of its employees are Asian (read: East Asian and Indian); and only 3% of its employees are Non-Asian Minorities.
I asked Scott why our default assumption should be uniform demographic distribution. When looking at statistical trends that emerge at large scales, we shouldn’t be surprised to discover that human populations cluster differently. At least, that’s my default assumption. The DH Conference draws more males, but then, an Early Childhood Education conference will draw more females. (I once attended a conference on speech and behavior therapy for autistic children; there were no more than three or four males amid about seventy females.) Or take a look at the National Association for the Education of Young Children. Although we often hear about the male-ness of executive boards, the NAEYC’s executive team is entirely female, and its 17-member governing board boasts 13 females and only 4 males. Looking at all the Early Childhood Education associations and organizations in the country, what gender trends would we expect to find?
The first question to ask about demographic distribution in any particular population (like Google’s workforce or citations in abstracts) is this: What are the characteristics of the larger population from which this particular population is drawing? As long as rhetorical scholars continue to look at rhetorical history, where most of the figures are male, then we can continue to expect many citations in these historical journals to be male. (This may change, however, as more and more rhetorical historians re-discover the history of female oratory.) Or, in Google’s case, if we take the American population as the baseline, assuming a 50/50 gender split, then clearly there is a gender imbalance. But in terms of race and ethnicity, its white workforce is in fact under-represented. Raising the percentage of blacks and Hispanics at Google would mean firing a lot of the Chinese and Indians, unless we want to make whites more under-represented than they already are. (A fairer baseline population would be the percentage of working-age adults in America, or, better yet, the percentage of working-age adults with college degrees; however, those stats are much harder to come by. Total population is a decent but imperfect proxy.)
The point is that we do not always find particular populations boasting a uniform or near-uniform demographic distribution. Why is this? A complex question. Given the totality of the human population (or, more humbly, the totality of any total population in a given geographic area), why do we find the smaller population clusters clustering the way they do around different practices? Why are there more males in CCC citations? Why are there more males at the DH Conference? Why are East Asians and Indians so over-represented at Google? Why are there so few East Asians and Indians in the NFL and the NBA? That populations cluster differently around different practices seems to be a statistical fact. Is it also a future inevitability?
