%%bloglink%%
Companies such as Bullionvault.com can quickly and easily tell you the price gold is going for today but I was curious if there were any economic data points that could be used as an indicators of what the price of gold would be going for in the near future.
To help answer this question I compiled the following five charts.
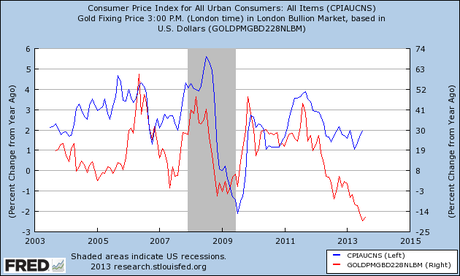
This first chart shows the year-over-year percentage change in the Consumer Price Index (aka inflation) vs. the year-over-year percentage change in the price of gold. If there was one data series I thought would be the strongest leading indicator for the price of gold I was sure it was going to be inflation and I was right…and wrong.
Late 2007 to late 2012 showed very strong connection between these two but a substantial difference started to occur in 2013 just as there was in the in 2004-2006 time frame.
This chart shows the year-over-year percentage change in the price of Gasoline vs. the year-over-year percentage change in the price of Gold. Very similar pattern to the above CPI vs. Gold chart which makes sense since gasoline is a component of CPI. 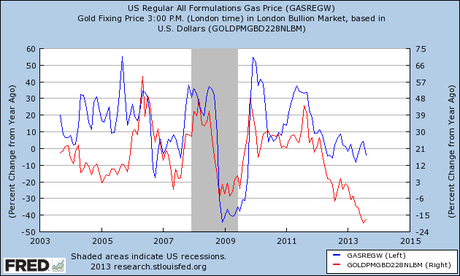
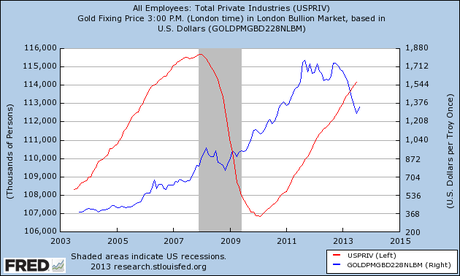
This chart shows Total Private Employment vs. Gold. Based on this graph, I don’t view changes in Total Private Employment as any type of indicator for changes in the price of Gold.
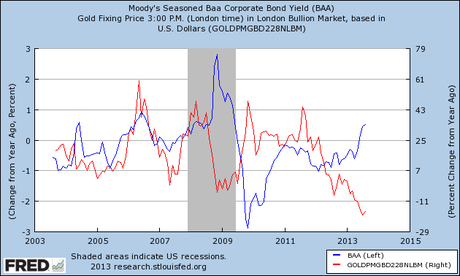
This chart compares the Yield on BAA rated Corporate Bonds vs. Gold. As a point of reference, BAA rated bonds rank about in the middle between the highest rated credit quality and lowest rated credit quality bonds.
My thought behind this comparison was to see if the price of gold followed in any fashion corporate interest rates and if so, did the correlation increase or decrease depending on why interest rates were changing.
For example, during 2009 bond yields (blue line) rose quickly as investors demanded higher interest rates in order to compensate them for lending their money during times of financial panic. Bond yields started rising again a few months ago not because of a financial panic but rather because the economy was doing better and long term rates were coming back to normal.
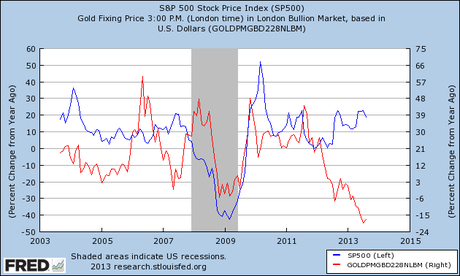
This chart shows the year-over-year percentage change in the S&P 500 Index as compared to the year-over-year percentage change in the price of gold.
When people are afraid or unsure of their near term economic future, they have historically preferred to hold cash instead of promises for future earnings (which is essentially what stocks and bonds are). The reverse is also true. Confidence in the future inspired people to become investors rather than savers.
In comparing the S&P 500 Stock Index with the price of gold, I was trying to determine if people viewed gold as an equal replacement to cash or if they viewed it as an investment. If gold and cash were the same then you would expect to see the S&P 500 Stock Index and gold move opposite to each other.
The chart shows, however, that gold and stock prices moved almost in identical fashion from 2008 to 2012. The other years showed neither a negative nor a positive correlation to each other.
